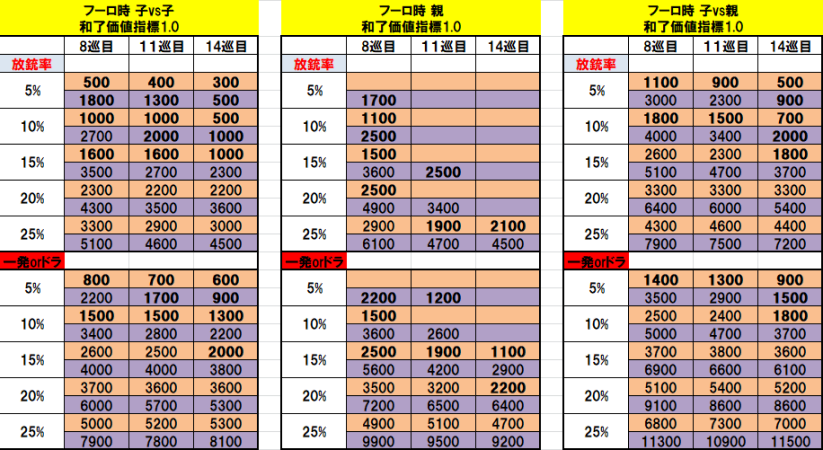
Explanation:
This chart shows the breakpoint hand value when pushing a tenpai against a riichi to have zero EV. If your hand is worth more, pushing will net you points in the long run, if your hand is worth less, folding will net you more.
First table is for not-dealer vs not-dealer riichi, second table is for dealer vs not-dealer riichi, third table is for not-dealer vs dealer riichi. Against dealer you need more value to push.
The columns are the turn you're in: 8th, 11th, 14th. The later you are, the more the points for tenpai/noten matter.
The rows are the expected deal in % of the tile you have to push. You should count the number of suji out, consider the probability of not-suji, and add some bias from pond reading. Some wwyd books in the resources section show explicitely the deal in %, so you can practice on that. The more risky the tile is, the more value you need.
The top and bottom tables are for "normal" tiles and tiles that give 1 han more, meaning the ippatsu tile and dora. You need more value to push those tiles.
The orange and purple colors indicate having a good or bad wait. The worse the wait, the more value you need.
Once you know all this, you have to factor in your placement, your distance from other players, your goal and if you're willing to bet on less likely outcomes. This is the hardest part, but knowing the starting point (EV) helps.
If you want to see the source, it's from Youtube (japanese needed) , by the same guy that made the "Secrets of iishanten" video.